|
|
The target group of the organisation primarily consists of below poverty line Mushar families. In addition committment also lies with other below poverty line groups coming from other scheduled castes, depressed backward classes and minorities. These communities comprise the most depressed sections of the society. Embedded structural inequity (class and caste) in a context of extreme ecological vulnerability (recurrent floods) has been responsible for their extreme poverty by limiting their access to, and control over, assets, education, health care and other constitutionally ordained entitlements. The communities tend to depend on agricultural wages or casual non-farm jobs for income, as a large percentage are landless, owning, if any, lower quality livestock. Even such opportunities are rendered scarce by the recurrent floods and the poor evolution of the secondary and tertiary sectors in the region forcing men to depend on seasonal migration to bigger cities or other states to secure their livelihood. For most of the year, predominantly women, children and elderly people are left in the villages.Historically marginalised with literally no opportunities to participate in decision-making processes,
the marginalisation of the target communities manifests itself even in spatial terms as they reside on the periphery of the settlements in a hamlet at some distance from the village.Dominant social forces coupled with the drudgery entailed in meeting survival needs hardly allow these communities to organise and to resort to development initiatives collectively. Fatalism is a predominant characteristic of these communities who look upon their present state as a fate ordained for them by some superior force which in turn hinders any conscious building of social capital. Thus class and caste characteristics get strongly associated with lack of opportunities with scheduled castes being thrice as poor when compared with upper castes. Lack of education, poor health, inadequate access to safe drinking water and sanitation and poor hygienic conditions get further perpetuated by these high levels of poverty.
|
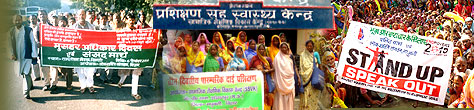
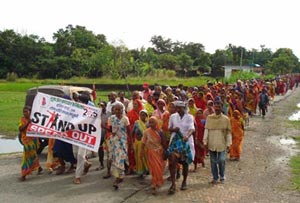
SSVK target groups procession on Food Right Day in Bihar |
|
|
Pond freed from possession of dominant person by Gramkosh
movement in Madhubani district
|
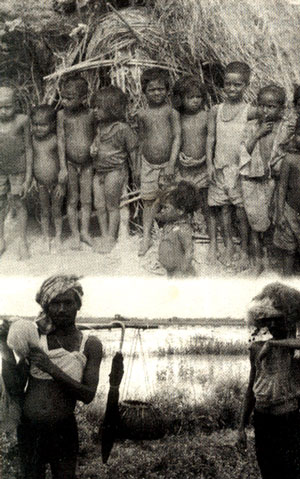
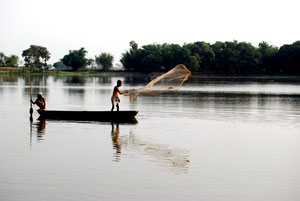
Daily life of children (Mushar) and fisherman in SSVK’s target area
|
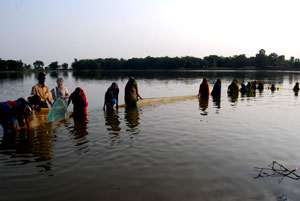
women fishing in pond (Income Generating Activity in
SSVK’s targeted village) |
|
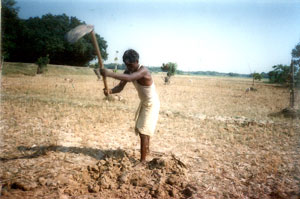
Cutting soil (Main traditional profession of Mushar community)
|
|
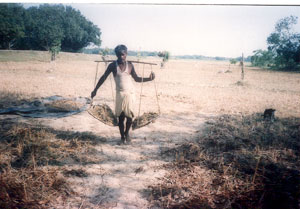
Mushar carrying soil by TALA (A traditional equipment to carry soil)
|
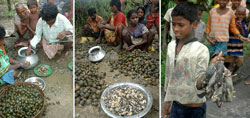
- Daily life of mushar community (Rat and Snail eating)
|
Profile of Bihar |
|
Bihar is the poorest state in India with the lowest per capita income amongst the
major states 4. In 2004/05, the real per capita GSDP was Rs. 4435 while the nominal per
capita GSDP was Rs. 7080 which were less than half that of the neighbouring state of
Jharkhand. More than 40% of the population lives below the poverty line. It is also the
third most populated state with a total population of 83 million. The state’s performance
lags seriously behind others. Although moderate progress was made during the 1990s
(1993-94 to 1999-00) in reducing poverty by nearly 7 percentage points, the rate of
poverty reduction was well below the national average. Current projections are that
Bihar is likely to fall well behind on most of the MDG targets for 2015. Bihar’s rank for
HDI among the Indian states has remained unchanged at 15 since 1981 while its score
has increased marginally from 0.237 in 1981 to 0.308 in 1991 to 0.267 in 2001. It fares
very badly on a number of indicators. In the 1990s Bihar had the lowest Gender Equality
Index in India, and had witnessed a decline in absolute terms over the earlier period.
Bihar Towards a Development Strategy. A World Bank Report; G.S. KANG, Chief
Secretary, Government of Bihar
Challenges of Economic Policy Reform in Asia May 31 - June 3, 2006, the 2006 Pan Asia
Conference. Stanford Center for International Development
According to the 2001 census Bihar has the lowest literacy rate in the country - 48%
against a national average of 65%. It is the only state where primary enrolment fell
between 1993 and 1999, and 80% of the bottom quintile heads of household have no
education.
Bihar is a predominantly agrarian economy with a small manufacturing base. The
share of services has increased from 41% to nearly 50% of GSDP, which is roughly the
same as the Indian overall average. While the share of agriculture has declined, it is still
very large. According to the NSS, nearly 40% of the workforce is engaged in agricultural
labour (1999-2000) down from 42% in the previous round. Cultivation and farm labour
together account for 80% of employment.
Crop productivity has been below the Indian average for most cereals. The causes
for the large yield gap include: low investment rates, lack of water management with
annual flooding of the Gangetic plain, weak transport and marketing infrastructure as
well as severe fragmentation of land holdings. 31 districts are flood prone and 11 are
drought prone. Only five districts are not prone to floods and drought.
Poverty is predominantly rural in Bihar and is associated with limited access to land
and livestock, poor education and health care, as well as low-paid occupations and
social status. NSS data show that 75% of the poor were landless or near landless in
1999-2000. Although land reforms were introduced in 1950 they have been slow and
ineffective. The rural poor tend to depend on agricultural wages or casual non-farm jobs
for a living. Over time the proportion of non-farm labourers in the poorest quintile has
increased and the proportion of farm workers decreased.
North Bihar and the Chhotanagpur Plateau are significantly poorer than southern
parts of the region. Regional variations are in part explained by structural factors such
as ecology, population density, infrastructure and transport, but belonging to a
scheduled caste or being female or landless significantly increases the risk of being
poor. SCs and STs are likely to be three times poorer than other castes. They are also
three times more likely to be landless, and their status on these two counts has
remained virtually unchanged since 1993-94. They are deprived on various counts:
only 2.9 per cent of Scheduled Tribe and 4.9 per cent of Scheduled Caste households
had access to electricity, compared to over 14 per cent in the case of other households.
Muslims do not do very well either: a study by Patna-based Asian Development
Research Institute (ADRI) on the socioeconomic status of Muslims found that 49.5
percent of rural Muslims and 44.8 percent of urban Muslims live below the poverty line.
Take the case of the Musahar who are classified as a scheduled caste. They are
spread across the districts of Madhubani, Muzaffarpur, Darbhanga, Champaran,
Hazaribagh, Santhal Pargana, Bhagalpur, Munger, Purnia, and Gaya. There were
13,91,000 Musahars in Bihar in 1981 (not clear if enumerated since then). They are
thought to be an offshoot of the bhuiya tribe of Chhota Nagpur and are in fact referred to
by that name in Bihar as well. The name translates into rat-taker or rat-eater. Musahars
are mainly landless agricultural labourers. The Musahars have largely remained on the
periphery of society.
Mukul 1999.Everyday Life of Musahars in North Bihar EPW Special Articles December 4, 1999
Bihar has a poor record on poverty alleviation programmes and government
services, for example, serious mis-targeting in the PDS and chronic teacher
absenteeism. Electricity supplies have been erratic: in 2003-04, per capita consumption
of electricity was 44.85Kwh as compared to 606Kwh at the national level. Transmission
& Distribution losses for the state are 37.69%. Less than 8% of the 81,655 km of roads
in Bihar are national or state highways. Approximately 45% of the road network is
unpaved. Although 50% of the assessed ultimate irrigation potential from major and
medium irrigation schemes has been created, the utilisation of these is only 60%. It
must be noted that the new government has introduced a number of policies to address
these problems and it is likely that these measures will improve the rural economy and
provide people with more opportunities close to home.
|
Physical Features |

|
Latitude |
21°-58'-10" ~ 27°-31'-15" N |
|
Longitude |
82°-19'-50" ~ 88°-17'-40" E |
|
Rural Area |
92,257.51 sq. kms |
|
Urban Area |
1,095.49 sq. kms |
|
Total Area |
94,163.00 sq. kms |
|
Height above Sea-Level |
173 Feet |
|
Normal Rainfall |
1,205 mm |
|
Avg. Number of Rainy Days |
52.5 Days in a Year |
| |

|
|
Administrative Units |
|
Divisions |
9 |
|
Districts |
38 |
|
Sub-Divisions |
101 |
|
CD Blocks |
534 |
|
Panchayats |
8,471 |
|
Number of Revenue Villages |
45,103 |
|
Number of Urban Agglomerations |
9 |
|
Number of Towns |
130 |
|
- Statutory Towns |
125 |
|
- Non-Statutory Towns |
5 |
|
Police Stations |
853 |
|
- Civil Police Stations |
813 |
|
- Railway Police Stations |
40 |
|
Police Districts |
43 |
|
- Civil Police District |
39 |
|
- Railway Police District |
4 |
|
|
|
Key Statistics - as per 2001 Census (Provisional) |
|
Population |
8,28,78,796 |
|
- Male |
4,31,53,964 |
|
- Female |
3,97,24,832 |
|
Population (0~6 Years Group) |
|
|
- In Absolute Numbers |
1,62,34,539 |
|
|
|
|
|
|
|
- Percentage of Total Population |
19.59% |
|
|
|
|
|
|
|
Literacy |
|
|
- In Absolute Numbers |
3,16,75,607 |
|
|
|
|
|
|
|
- Percentage of Total Population |
47.53% |
|
|
|
|
|
|
|
Decadal Population Growth (1991-2001) |
130 |
|
- Absolute |
1,83,48,242 |
|
- As Percentage |
28.43% |
|
Highest Decadal Growth at |
Sheohar District (36.16%) |
|
Lowest Decadal Growth at |
Nalanda District (18.64%) |
|
- Civil Police Stations |
813 |
|
- Railway Police Stations |
40 |
|
Density of Population |
880 per sq kms |
|
- Highest Density |
Patna, 1471 per sq kms |
|
- Lowest Density |
Kaimur, 382 per sq kms |
|
Sex Ratio (Females/Thousand Males) |
921 |
|
- Highest Ratio |
(Siwan) 1,033 |
|
- Lowest Ratio |
(Patna) 873 |
|
Highest Literacy Rate |
Patna, 63.82% |
|
Lowest Literacy Rate |
Kishanganj, 31.02% |
|
Average Population of a District |
22,39,967 |
|
SSVK
State Co-ordination cum Correspondence Office: |
SSVK
North Bihar Training Cum Field Office |
Emails & Web |
Lok Shakti Bhawan,
Opp:Ajay Nilayan Apartment,
Parmanand Path, Nageshwar Colony
Boring Road, Patna – 800001
Tel/FAX: +91-612-2522077
Mobile: +91-94310 25801
+91-99731 61483 |
J.P. Gram, Balbhadrapur,
Jhanjharpur (R.S.)
District - Madhubani
BIHAR, PIN – 847403 INDIA
Tel/FAX: + 91-6273-222242
Mobile: + 91-99399 84568 |
E-mail (S):
- ssvkindia @ gmail.com
- ngossvky86 @ yahoo.com
- deepakbharti @ ssvk.org
Web : http://www.ssvk.org |
|
Registered under Society 1860, Income Tax-Tan, Pan, 12A and Exempted under 80 G
|
|